It is easy to script analysis steps with IDAPython, but now we want to automate this analysis over, let’s say, 10,000 files. I did a quick Google and I couldn’t find a guide on how to perform batch binary analysis tasks by automating IDA Pro 7.x.
Unfamiliar with this, I was constantly guessing whether it was the command-line arguments, the script, or a combination of both that was not working. I’m sharing my experience here so you won’t have to be fumbling around like I was.
I will be using IDA Pro for Windows here, but it should be applicable to any of their supported platforms like Mac or Linux.
Simple Binary Analysis
Let’s write some simple IDAPython analysis script and run it within the IDA Pro console. This script loops through all functions in the executable and prints out its address and name:
import idc
import idautils

print 'count %d' % len(list(idautils.Functions()))
for ea in idautils.Functions():
    print hex(ea), idc.get_func_name(ea)
The idautils module contains higher-level functionality like getting a list of functions, or finding code & data references to addresses. If you are familiar with IDC scripting, most of the functions by the same name can be found within the idc module. This is not really meant to be an IDAPython or IDC scripting tutorial, so you will need to look elsewhere for that.
When you run this script on Windows notepad.exe, you should get something like the following:
count 381
0x140001008L sub_140001008
0x1400010b0L EnableCallback
0x140001130L sub_140001130
 .
 .
0x14002107cL __GSHandlerCheckCommon
0x1400210e0L __GSHandlerCheck_SEH
0x140021176L memcmp
0x140021182L memcpy
0x14002118eL memset
0x14002119aL wcscmp
0x1400211b0L sub_1400211B0
0x1400211d0L sub_1400211D0
 .
 .
0x1400213b0L sub_1400213B0
0x140021410L sub_140021410
0x140021440L sub_140021440
Because I chose not to load the PDB file from Microsoft’s servers, we see a lot of un-named functions, which is normal, but we also see a lot of familiar C functions, like memcmp and wcscmp. As we are only interested in functions defined within the binary, we need to filter out typical library functions, as well as thunks in the binary:
for ea in idautils.Functions():
    if idc.get_func_flags(ea) & (idc.FUNC_LIB | idc.FUNC_THUNK): continue
    print hex(ea), idc.get_func_name(ea)
You should now mostly see only un-named functions, like sub_xxx. Any named functions are probably a result of the auto-analysis.
You can count the number of functions, or get the function lengths, or use idautils.CodeRefsTo() to find calls to these functions. This largely depends on what kind of analysis you want to perform.
Scaling Up The Automation
Now that we have the “analysis” working for a single file, let’s try to scale this up over a directory, or even the entire filesystem.
Since IDA Pro 5.7, they introduced the -S argument for running scripts. Since then, there have been quite a few changes. I noticed some guides referencing idaq.exe, which was the main QT binary in older versions. In even older versions, this file was idag.exe, G for GUI. In newer versions though, this file is just ida.exe or ida64.exe.
You can invoke IDA Pro with the following command-line arguments:
ida64.exe -c -A -Syour-script.py C:\notepad.exe
You specify your script with the -S argument. As the IDA help states, you either need to specify -B for batch mode or -c -A; otherwise, your script does not get run. The help also goes on to recommend that you use the text UI:
The text interface (
idat.exe/idat) is better for batch mode because it uses less system resources.
I never knew the IDA Pro text mode UI was still maintained up till now. For those who don’t know, here’s what it looks like when invoked:
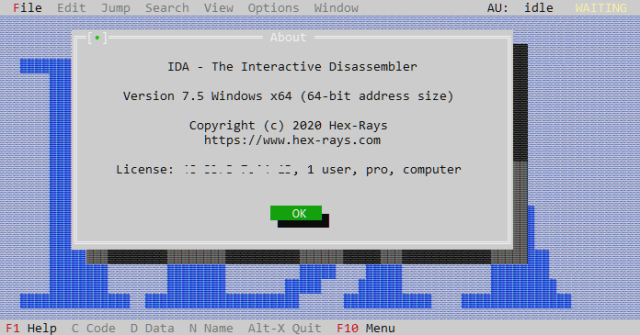
But of course when you invoke it with -A, the UI is suppressed.
Script Changes
You will need to make a few key changes to your script before automation.
- You need a log file.
Script output is not shown on stdout, so in order to collect information
from the script, you will need to open a file and write the output there instead. -
You need to exit.
You have to callidc.qexit(0)at the end of your script, or the process will hang.
Let’s make those changes to our script:
import idc
import idautils

# (1) open our log file here
f = open('/Users/darell/Desktop/analysis.txt', 'a')

# probably a good idea to log the current filename
f.write(idc.get_input_file_path() + '\n')

f.write( 'count %d\n' % len(list(idautils.Functions())) )
for ea in idautils.Functions():
    if idc.get_func_flags(ea) & (idc.FUNC_LIB | idc.FUNC_THUNK): continue
    f.write( hex(ea) + ' ' + idc.get_func_name(ea) + '\n' )

f.close()

# (2) remember to exit IDA Pro
idc.qexit(0)
You will also probably want to log the current file path that is being analyzed.
After running your script with IDA Pro (text UI) like so:
ida64t.exe -c -A -Syour-script.py C:\notepad.exe
You should get an output file on the Desktop (make sure you modify the hardcoded log file path first).
Opening the log file, you should get an output like this:
c:\notepad.exe
count 300
0x140001008L _TlgWrite
0x1400010b0L _TlgEnableCallback
0x140001150L wil::details::_dynamic_initializer_for__g_threadFailureCallbacks__
0x140001210L wil::details::_dynamic_initializer_for__g_featureStateManager__
  .
  .
0x140021350L wil::details::_dynamic_atexit_destructor_for__g_featureStateManager__
0x1400213b0L wil::details::_dynamic_atexit_destructor_for__g_enabledStateManager__
0x140021410L _dynamic_atexit_destructor_for__szFileName__
0x140021440L _UpdateTitle_::_2_::_dynamic_atexit_destructor_for__previousFileTitle__
You should notice a few things are different:
- The functions now have names.
IDA Pro loads the PDB file by default, so that’s how the names come about.
On an unknown binary that you are analyzing, it is quite unlikely you will get symbol names. -
There are only 300 functions, instead of 381 previously.
The missing ~80 functions are because auto-analysis did not run. You will need to call ida_auto.auto_wait() or idc.auto_wait() to wait for auto-analysis to complete first. Otherwise, you will find that your script will not be able to find the functions.
Read-only Volumes
Sometimes you want to keep your volumes or images containing the sample binaries read-only, and IDA Pro doesn’t like that:
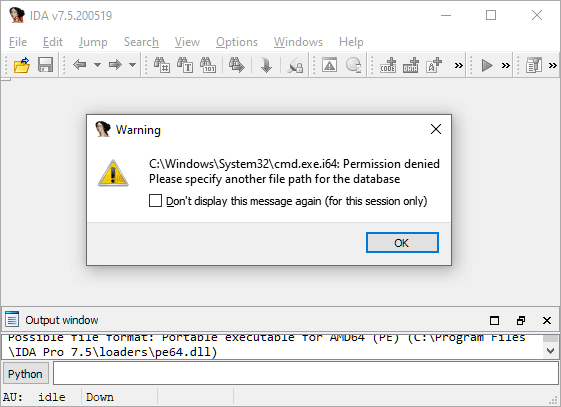
IDA Pro, by default, creates the IDB database file (and friends) in the same directory as the target executable. If your target binaries are in a read-only location, like the Windows system32 directory here, this causes issues. One workaround might be to copy the binary to a temporary read-write location and run IDA Pro from there, but this means your analysis script won’t know the binary’s full path, which might be important when doing batch analysis.
Fortunately, you can also specify the location of the database file with -o:
-o%TEMP%\foobar.idb
This ensures that the script still knows the original filepath, but without IDA complaining it can’t write to the target directory.
Debugging
If your script is not working, you might think “there’s a -z debug flag, let’s use that”. What ends up happening is you see a ton of messages, but your script doesn’t get executed at all. Your best bet for debugging is to load it in the IDA Pro GUI and check out the errors.
You might also run into the annoyance that the script contains idc.qexit(0), so IDA Pro constantly quits on you if your script has no errors. On the other hand, if you forget to call idc.qexit(0) at the end of your script during automation, then the process hangs and/or consume 100% CPU. We will attempt to solve that problem below.
Old Code
As of IDA Pro 7.4, older code that was meant for versions 6.x will no longer work, because they turned off backwards-compatibility by default. If you are on a newer version of IDA Pro and trying to use scripts floating around the Internet, you will definitely run into this issue.
For example, idc.Exit(0) doesn’t work anymore, you need to use idc.qexit(0).
Some scripts will call idaapi.autoWait(), but that is also gone. You can either call ida_auto.auto_wait() as the documentation suggests, or it is also aliased as idc.auto_wait().
Refer to this guide for porting old scripts: https://www.hex-rays.com/products/ida/support/ida74_idapython_no_bc695_porting_guide.shtml
A Better Script
Now that we have the basics figured out, let’s try to create a better script that you can run in both the GUI and for automation. One thing we can take advantage of is script argument passing. You can pass arguments to your script like so:
-S"your-script.py arg1 arg2"
We shall use this for a few things, (1) removing the hard-coded log file path and (2) signalling to the script that it is being run externally.
The script arguments can be accessed via idc.ARGV like so:
f = open(idc.ARGV[1], 'a') if len(idc.ARGV) > 1 else sys.stdout
log = f.write
So now, log will be our logging function (instead of print), and depending on whether an argument was passed, it will either be a file handle to that path, or sys.stdout, which goes to the IDA Pro output window.
At the end of the script, we decide whether or not to exit IDA Pro depending on the value of the file handle:
if f != sys.stdout:
    f.close()
    idc.qexit(0)
With these changes, the same script can be run from the IDA Pro GUI, or from the command-line when automating the analysis of a large corpus.
Combining all of the arguments above, we can execute the analysis script over all EXEs in C:\Windows like so:
FOR %f IN (C:\Windows\*.exe) DO idat64.exe -c -A ^
        -S"analysis.py %USERPROFILE%\Desktop\analysis.txt" ^
        -o%TEMP%\foobar.idb ^
        %f
This will generate the output file on your Desktop and also allows you to open files from a read-only location like C:\Windows because the database file will be created in %TEMP%.
References
You can download the entire script here: https://gist.github.com/geekman/dc368bda9ab3b72cedda867f86b2bc07
Other IDA Pro command-line arguments can be found here: https://www.hex-rays.com/products/ida/support/idadoc/417.shtml
Blog post introducing IDA Pro’s -S script argument: https://www.hex-rays.com/blog/running-scripts-from-the-command-line-with-idascript/
IDAPython source code on GitHub: https://github.com/idapython/src
Subsequently, you can also perform more advanced analysis. Here are some links for your inspiration:

Good job 🙂 I depicted the procedure before in Chinese, and wrapped it in python scripts.
[…] Interactive Disassembler (IDA) Pro Batch Binary Analysis with IDAPython scripts – IRQ5. […]