Framework for Writing Flexible Bruteforcers

When writing a bruteforcer, it’s easiest to think of it as mapping some kind of output to a monotonically-increasing number.

Like for one of the solved PlaidCTF question, the answer string was composed from the eight letters “plaidctf”, which conveniently is a power of 2, meaning each output character can be represented with 3 bits. To write a bruteforcer for a string composed of these characters, you might imagine generating a 3-bit number (i.e. from 0 to 7) then mapping it to the character set for one output character, or a 30-bit number if the output string was 10 characters. Unsurprisingly, this was exactly what I did for my solver script. The output string was generated from a BitVector of 171 * 3 bits.

But what if the output was composed of several different pieces that cannot be represented uniformly as a set of bits?

One solution might be to emulate such a behaviour using an array of integers, like how I modified my solver script in version 2 to handle a character set of arbitrary length.

In this post, I will walk-through writing a basic, but flexible, bruteforcer with accompanying code snippets in Go.

Keeping State

Continuing on the CTF puzzle, the BitVector was replaced with an array of Ints. Each Int will represent one character of the output string. We can thus represent the state like so (for simplicity, let’s limit the output string to 2 characters):

type state struct {
    digit [2]int
}

In order to increment each digit, we can write a function that increments state.digit until a certain number, then resets it to zero.

To make it generic, we will write a function that returns another function that manipulates a digit position, so we don’t have to copy & paste the code for each digit position:

// returns a function that manipulates the digit at given pos
func digitManipulator(pos int) func(*state) bool {
    return func(s *state) bool {
        s.digit[pos]++
        if s.digit[pos] == MAX_NUMBER {
            s.digit[pos] = 0
            return true
        }
        return false
    }
}

We will talk more about the boolean return value later.

Continue reading

X-CTF 2016 Badge Firmware

As promised, we are releasing the source code for the X-CTF badge, about 1 month after the event to give interested participants the chance to take a crack at it. If you are interested in the badge design process, check out my previous post on the hardware aspects.

Jeremias and Jeremy gave a talk at one of the Null Security meetups. Check out the slides if you haven’t already. In one part, Jeremy talks about the custom firmware he wrote for his badge and the additional challenges he set up for partipants to get more points. The 2nd part of the talk covers the electronic badge and challenges.

The Challenges

The challenges try to exploit the nature of being a self-contained electronic device. Rather than trying to replicate more CTF puzzles and simply placing them into the badge, we specially designed them for the badge.

You can find the answers to the badge puzzles (and the main CTF puzzles) in the X-CTF GitHub repo, which was released shortly after the event.

Since there’s only a single entry point into the set of challenges (meaning you must solve each puzzle before getting to the next), the puzzles must be designed with increasing levels of difficulty; too difficult and the participants will totally give up.

Stage 1: Catch Me If You Can

animation of challenge 1

I particularly like this one. Unlike a program running on the computer, you can’t easily snapshot the state of the program, nor try to influence (slow down) its execution.

Continue reading

Unpacking Xiaoyi Firmware Images

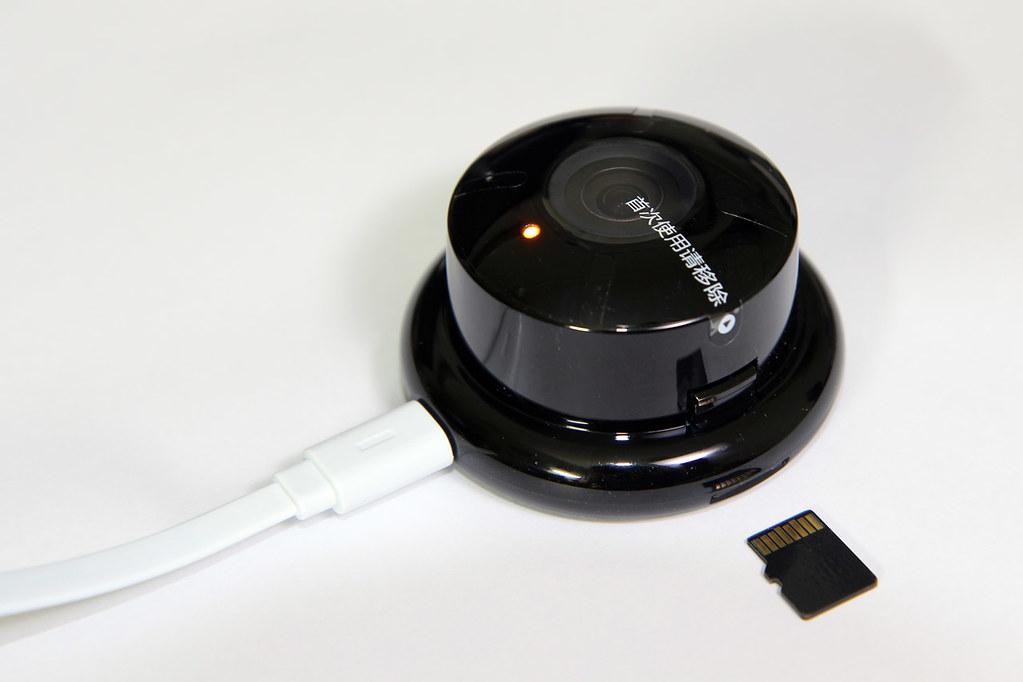
Xiaoyi camera

I recently decided to buy new toys to monitor my home — the Xiaoyi IP Camera (I bought more than one). The device itself is round, rather small (as pictured here) and fits into a plastic stand to prop it up. It accepts a microSD card for local recording, and it is only accessible via their iOS/Android app after pairing. The camera is only 720P and goes for 149 RMB (less than US$25).

Since these devices can see a live stream of my house at any time, I would prefer them to be completely within my control. This can be done either via an audit of the firmware or by replacing the firmware with your own (both options are equally tedious). After the “B” firmware version, they also removed RTSP streaming support. You could downgrade to the “B” version, but you won’t benefit from newer changes they have added since then. Let’s get to it.

You can find the firmware images of the Xiaoyi camera online, typically in a ZIP file. I have provided links to this at the end. Unpacking the ZIP file gives you a single file called home. Running the file command reveals that this is a U-Boot image with the file system image tacked on:

home: u-boot legacy uImage, 7518-hi3518-home, Linux/ARM, Filesystem Image (any type) (Not compressed), 7974512 bytes, Wed Jan 21 16:14:18 2015, Load Address: 0x00000000, Entry Point: 0x00000000, Header CRC: 0x2F0FAD85, Data CRC: 0x4B21D5F9

To get to the file system image, a StackExchange answer recommended using U-Boot’s mkimage and a bit of file manipulation to carve out the data. This made me almost want to write my own tool in Python but fortunately someone had already done this before. Use uImage.py from that site to extract the file system image from this home. The file system image is a JFFS2 image named 7518-hi3518-home, and our next mission is to mount it.

Continue reading

Patching ZIP Files

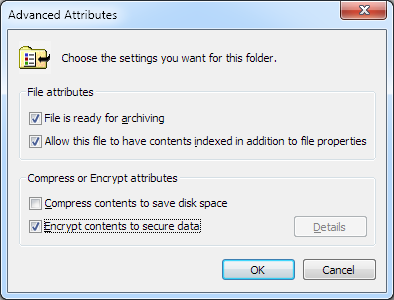
I have recently been working with VM images and to transport & distribute them conveniently I had to zip them up. I mainly work in a Windows environment and I use 7-Zip for packing and unpacking archives. It’s actually quite nice (and free), if you don’t mind the spartan interface. On my workstation, I have NTFS file encryption (EFS) enabled on my home directory. The way this works is that you can selectively encrypt files and folders by setting a special attribute on these items.

NTFS encryption attribute

I was in a hurry to prepare a VM image for a class and I used 7-Zip to archive the entire VM folder. The problem was, this encryption attribute was also recorded in the ZIP file and I only realized it when I unpacked it on a machine for testing right before the class started. On a machine that does not use NTFS, it warns the user and asks if it should continue extracting unencrypted. On a machine with NTFS, the destination files get encrypted and Windows starts nagging the user to back up the EFS keys. Compressing a 9 GB image into a 3 GB ZIP file took about 40 minutes, so there was really no time left to decrypt the files (EFS really sucks in this regard) and re-compress it into a ZIP file without encryption.

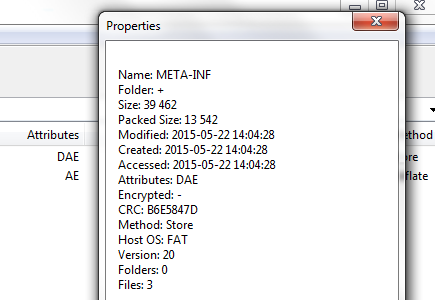
You can check whether a file is marked for encryption by checking the Attributes column in 7-Zip. (Note that this encryption attribute is native to NTFS and is different from ZIP file encryption.) The attribute string is somewhat cryptic but E means encrypted and A is archive. Interestingly, 7-Zip itself does not restore the encrypted attribute, but the native Windows unzipping functionality does.

ZIP attributes

Patch All The Things!

While I did not manage to solve this annoyance in time for the class, I had this idea to write a tool that would just patch the ZIP file. No changes need to be made to the file data and so there is actually no need to re-compress it.

Continue reading

Visualizing Binary Features with matplotlib

Some time ago, I started playing around with data analysis and machine learning. One of the more popular tools for such tasks is IPython Notebook, a browser-based interactive REPL shell based on IPython. Each session becomes a “notebook” that records the entire REPL session with both inputs and (cached) outputs, which can be saved and reviewed at a later time, or exported into another format like HTML. This capability, combined with matplotlib for plotting and pandas for slicing and dicing data makes this a handy tool for analyzing and visualizing data. To give you an idea of how useful this tool can be, take a look at some example notebooks using the online notebook viewer.

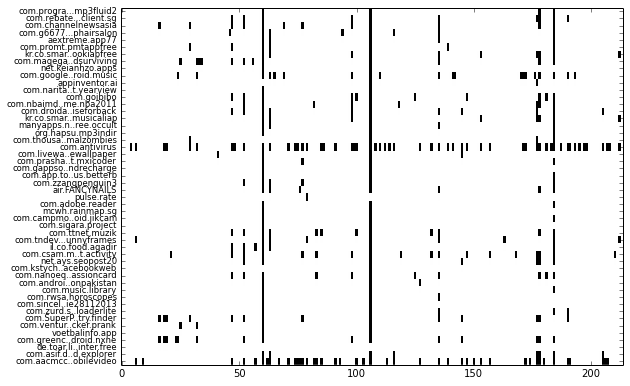
In this quick post, I’ll describe how I visualize binary features (present/not present) and clustering of such data. I am assuming that you already have experience with all of the above-mentioned libraries. For this example, I’ve extracted permissions (uses-permission) and features (uses-feature) used by a set of Android apps using Androguard. The resulting visualization looks like this:

visualization of binary features

Each row represents one app and each column represents one feature. More specifically, each column represent whether a permission or feature is used by the app. Such a visualization makes it easy to see patterns, such as which permission or feature is more frequently used by apps (shown as downward streaks), or whether an app uses more or less features compared to other apps (which shows up as horizontal streaks).

While this may look relatively trivial, when the number of samples increase to thousands of apps, it becomes difficult to make sense of all the rows & columns in the data table by staring at it.

Continue reading