Around this time last month, the haze (or what some people call smog) here set a record high level for the Pollutant Standards Index (PSI). This is what it looked like outside:

As our National Environment Agency only published 3 hour PSI averages, I thought it would be good if we could get our own measurements. The PSI used here is somewhat like the Air Quality Index (AQI) used in the US, and is made up of 5 components:
- PM10 particulate matter
- sulphur dioxide (SO2)
- carbon monoxide (CO)
- nitrogen dioxide (NO2)
- ozone
Note that the AQI includes PM2.5 particulate matter whereas PSI does not. From what we can see, I would think that a major contributor to the PSI is particulate matter (PM).
I took a brief look at the projects such as the Air Quality Egg and PACMAN. They used either the Sharp GP2Y1010AU0F or the Shinyei PPD42NS. These sensors generally operate based on the light-scattering principle, by measuring the amount of light that is scattered by particles.
The PPD42NS
Chris Nafis has done a great job documenting the use of both the GP2Y1010AU0F and the PPD42NS, compared against a Dylos DC1100 air quality monitor. As the GP2Y1010AU0F requires a certain pulse waveform to be supplied to its LED pin, I would say that the PPD42NS is self-contained and thus much easier to hook up.
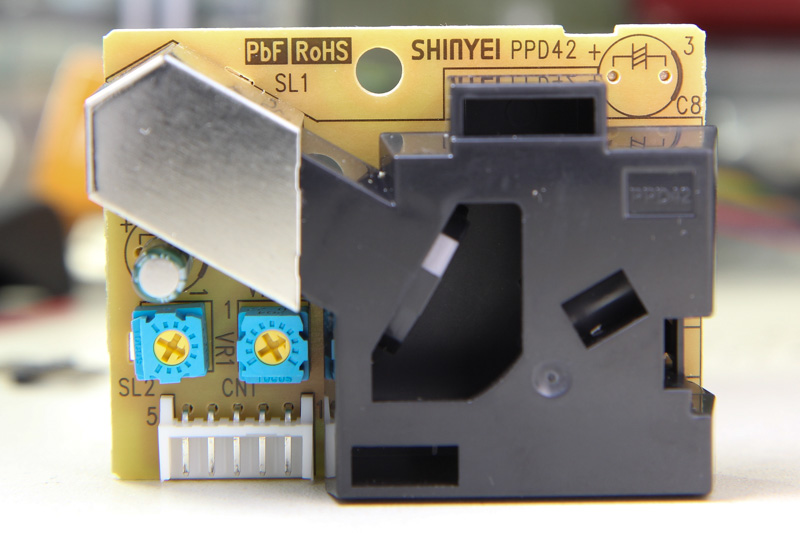
On the front, it has 2 pots labelled VR1 and VR3 that have been already factory-calibrated. The IR detector is covered under the metal can. Interestingly there’s a slot by the side labelled SL2 which is unused. If you’d like to see what’s under the hood, Chris opened up the black casing and posted a photo here.
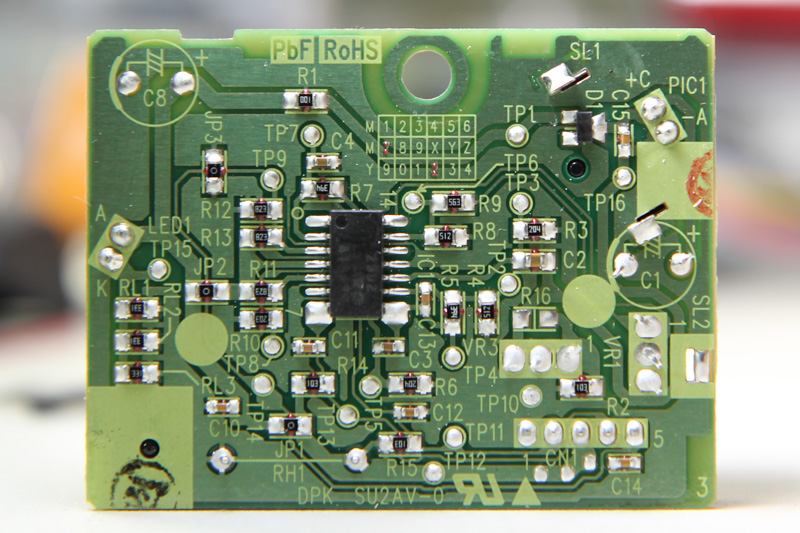
Looking at the date code grid on the PCB, the units look like they were manufactured in July 2012. The circuit consists largely of passives and an op-amp. RH1 is the resistor heater which, in theory, could be removed to save power if there was some other method of air circulation.
Sensor Placement
There are several points that should be observed when deciding how the sensor is placed.
- The sensor must be placed in a vertical orientation. This is easy to understand as the heater is located below. Any other orientation would not achieve the desired airflow expected by the designers.
- The sensor should be kept in a “complete [sic] dark condition”. I believe the unit is smart enough to not be affected by normal lighting as it uses infrared, but I guess it is still a good measure.
- “Also soft cushioning material to seal the gap between sensor and housing is necessary.”
- Sensor should be located away “from any winds or air stream effected by air purifier”.
I’m not sure if leaving the sensor “window” exposed will affect the readings by a lot but David Holstius did cover it with some stiff paper.
Sensor Output
The sensor output is normally high, but goes low in proportion to the PM concentration, hence by measuring what they call Lo Pulse Occupancy (LPO), the PM concentration can be determined.
This LPO is recommended to be measured over a unit time of 30 seconds, but I opted to record at 15-second intervals instead to get a higher resolution. To get the LPO time for a 30-second time period, we just need to average the two 15-second values – simple math.
As I do not need the exact calibrated figures, there was no need to fit the values to the equation derived by Chris (yet). With the raw values recorded, I can always do this at a later time.
Note that the sensor readings are very noisy. Here are the plots over 24 hours, without averaging and with a 50 value rolling average (12.5 minutes):


It is definitely easier to read the graphs with averaging enabled. Subsequent graphs that appear in this post have a 15 value rolling average applied.
Test Setup
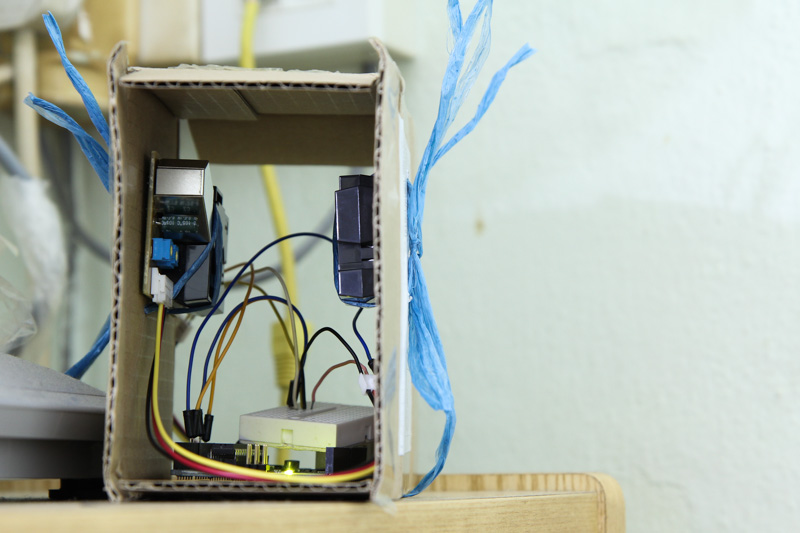
Using the same parcel that the sensors were delivered in, I punched a couple of holes on both sides, made sure they lined up and tied 2 sensors on either side using raffia string.
Both sensors were hooked up to an Arduino that measured the LPO time of each sensor and output them via serial. The Arduino was connected via USB to my Linux server which runs a simple Python script that timestamps and logs the values.
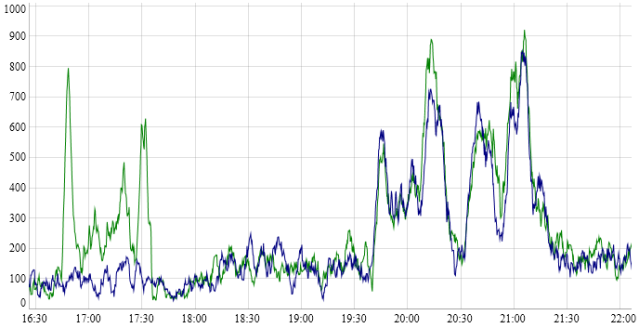
One of the sensors would produce a higher and sometimes spurious output occasionally and I couldn’t figure out why. However it would agree with the other sensor most of the time. This is also why I usually buy at least 2 sensors to make sure their readings are similar.
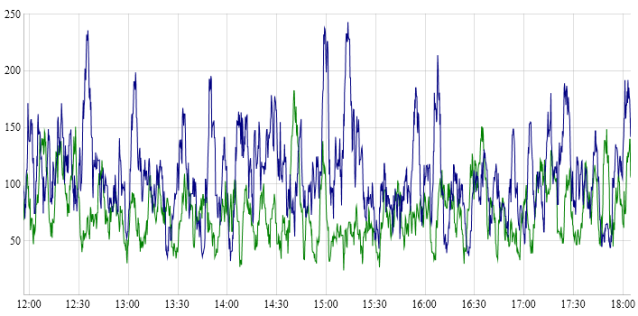
Notice the spike from one sensor occurring around 17:00 to 17:30:
Notice 2 spikes from only one sensor between 09:00 and 10:00, and the region from 06:00 to 08:00 shows a significantly higher reading:
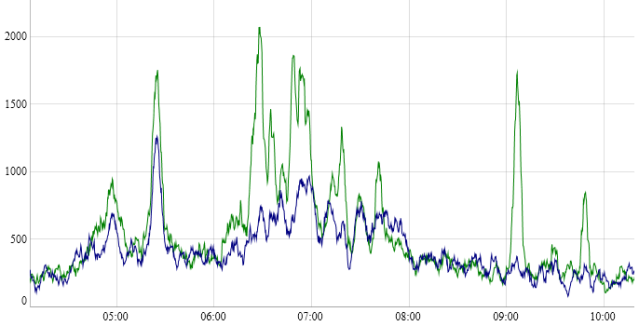
Subsequently, I took the sensors out, used a blower to remove any dust in the assembly, replaced the raffia string with twist ties and hooked them up again. I also closed the front of the box, leaving just a small slit for the air to flow through. The problem went away and I didn’t manage to figure out what was the cause.
Anyway, here’s what my ambient indoor readings (when nobody is home) look like:
The sensor is sensitive enough to pick up cigarette smoke. When nobody is at home and the doors and windows are closed, the PM concentration gradually goes down.
What’s Next?
Now that I’ve been measuring the level of particulate matter indoors, I will need to build a proper enclosure for outdoor use. I have an enclosure that looks very similar to this one that David Holstius used, but I plan to use a slightly bigger one so that I can house the electronics inside as well.
As I opted to ship the sensors by registered mail (it’s the cheapest method), it took about 3 weeks to arrive. By the time I received the sensors, the PSI had dropped back to normal or “safe” levels, which is no doubt a good thing. At least now I can start collecting data to get a baseline for “clean” air.

Hi Darell
very interesting post!
I tried to reproduce your results, but I encountered a problem with the LPO time as read from Arduino. Very often it is 0 ! I get a lot of zero and some “spikes” some time to time.
I used two PPD42 and two Arduino to be sure not to have some hardware failure, but always same results.
Do you have any suggestion or hint to improve my results ?
Thanks
Fabrizio
Hi Fabrizio, it sounds like you may be reading the output directly. The idea is the count the total amount of time that the output is zero, for about 30s.
You may want to try out this simple Arduino sketch here:
http://www.howmuchsnow.com/arduino/airquality/grovedust/grovedust.ino
dear Darell,
I measure the LowPulseOccupancy, as you suggest.
In order to make a further test, I uploaded the grovedust.ino sketch into Arduino and left it run during the last night. I got 1800 readings, of which more than 1300 are zero. ( I mean 0 LPO, the concentration is 0.62 because of the offset in the formula ). The lowest non-zero reading is 2200. The sensor is inside an office, and I expect quite low concentrations ( about 20 ug/m3 )
But so many zero values and the “step” between o and 2200 seems me quite suspect.
Do you observe similar data ?
Thank you in advances and ciao
Hi Fabrizio, the data doesn’t sound correct. I would suggest you plot it out to see how it looks.
You can try hooking the output pin to an oscilloscope and observe what happens when you blow at the sensor opening. You should see the LPO time increase.
Here are some sample readings (15s intervals): 0, 473, 294, 348, 0, 118, 0, 41, 601, 62, 143, 0, 290, 61, 0.
What formula are you using to convert particle counts/0.01 cu feet to concentration in ug/m3?
I’m not converting anything. These are the raw LPO times that are read from the sensor and plotted directly. I think it’s not very useful to convert them without having some reference to an accurate reading. If you are looking for a formula, see the excellent writeups by Chris Nafis linked within the post.
Did anybody ever figure out why the sensor gives Zero readings for 30 seconds or more? It’s not due to the the Hardware/firmware that reads the sensor, as I hooked it up to a PWM signal and it never read zero. It’s like the sensor just doesn’t work at times, then it spontaneously works again. It seems like something on board the sensor stops working for a time. Very weird and frustrating. Also I doubt the particle count is ever really Zero as it usually is around 800 in my work area.
Thanks.
I would suggest that anyone experiencing lots of noise cover the large hole over the detection area. With this open you are eliminating the chimney effect that draws the air up from the intake to the output (reducing the airflow), and you are going to be more exposed to turbulent drafts and any light noise in the environment.
Thanks for the suggestion. I’ll give that a go and see if it helps.
FYI, on a standard Arduino, pin 8 is considered the Input Capture pin and uses a 16 bit timer to measure pulse duration. The other pins use an 8 bit timer. If you used pin 8 for one sensor and a different pin for the other, this may explain some of your discrepancies.
Hi Walter, the sketch I’m using is just recording the pin state at a predefined interval and it does not use the Input Capture unit at all. This will enable me to sample the signal from both sensors at about the same time.
However, this setup is far from ideal. Sampling the sensors this way could miss out on some time when the signal goes low.
Hi, It’s nice to see this research. Could you share those figures in original post? It seems there’s problem the figure lost.
Darrell,
I have been trying to get a better response from the PPD sensors without averaging and found that adding the right fan in the right config made a lot of difference. I started with the PPD60PV-T2 and saw a massive (positive) difference that I documented here:
http://indiaairquality.com/
AJ
Nice! Thanks for sharing, I’ll take a look at it in detail.
[…] For those who have worked with the 42 or one of its cousins (the DSM501 and the Sharp GP2Y thingy) know that the data gives many many zeros. As in this blog post from Darrell Tan in Singapore. https://irq5.io/2013/07/24/testing-the-shinyei-ppd42ns/ […]
Hi Darell,
I referenced your article on my post today on modifying the PPD42NS to improve its response at:
Would love your comments!
thx,
A.J.
[…] Testing the Shinyei PPD42NS […]
I’m trying to use a PPD42NS dust meter with an Arduino Uno. I used the standard code from the wiki (http://www.seeedstudio.com/wiki/Grove_-_Dust_Sensor), but the values I’m reading are too erratic. I tested the sensor for several hours, in an office enviromnet (free of dust), but the sensor indicated a ratio around 30% and concentration of 45000!
I also measured the voltage on signal pin and it’s constantly oscilating.
Can anyone help me?
I have some tips on my blog on how to get the PPD42NS to work well. If you are getting erratic results, you need to a) verify the orientation b) smooth by averaging over several time periods (10 mins is good), c) make sure your power supply is clean.
If the environment has very little dust, the sensor is going to show erratic but low results. You can increase the sensitivity (and get less erratic results) by adding a resistor and a fan as I have described. Good luck!
A.J.,
Thanks for you advices. I have some comments:
a) I tried in two positions (vertically and horizontally). The results were almost the same. I kept it vertical after the tests;
b) Once the values indicated by the sensor are always high, the averaging of the values over a period also resulted in a high value;
c) I measured my power source with a voltmeter. The voltage was between 4,79 and 4,85V. I think those values are according to the specifications, right?
Thanks for your help!
Looks like there is light entering the sensor and resulting in a high reading constantly. Cover the front open part i.e. the triangular piece with a black non reflecting paper or tape. and also feel free to send a picture.
PS: Don’t set the sensor horizontal. Your PS seems fine.
Dear A.J.
Thanks your advice.
I got a solution from you!!!
🙂
I covered the the front opening and even tried to measure in the darkness, but nothing changed. Regarding the potentiometers, is it possible to adjust sensor’s sensibility with them? I kept the configuration from factory.
You should not be getting such a high LPO if the sensor is shielded from light, and is upright with no vibrations. No, do not change the pots that will not help. Send your code and I will take a look. If the code is ok, you may have a bad sensor.
I’m using the standard code available on senser’s wiki page (http://www.seeedstudio.com/wiki/Grove_-_Dust_Sensor).
I am trying something different. I read in a blog that the sensor have thwo channels: P1, which count particles between 1 and 10 microns, and P2, which counts particles betweeen 2.5 and 10 microns. Standard electrical connector has a wire for P1 channel only. I added another wire to measure P2 signal.
There results are very different: channel 1 is indicating around 45000 pt/cf while channel two indicates around 2500 pt/cf. Even though, I believe those values are too high for an office environment. Am I right?
Not really. The two channels are really just different thresholds of voltage. At P1 the voltage is 1.0 volts for P2 the voltage is 2.5 volts. So much less number of pulses make it over P2, hence the LPO on P2 is lower. Therefore I had modified the threshold on P2 to be lower than P1, approx 0.5 volts. This significantly increases the sensitivity of the sensor.
Also, using pulsein it is not easy to measure two pins. You need to move to interrupts if you want to measure both simultaneously. I assume you measured one and then the other i.e. not simultaneously ?
Back to your main issue, the numbers you are getting are way too high. Can you post a printout of your results ?
Actually I’m just using one channel now (P2). I’m considering a sample time of 30s.Those are the values I obtained for period of test:
low pulse occupancy: 1439962
ratio: 4.80
concentration: 2530.65
low pulse occupancy: 1368226
ratio: 4.56
concentration: 2397.52
low pulse occupancy: 1295275
ratio: 4.32
concentration: 2263.46
low pulse occupancy: 1281659
ratio: 4.27
concentration: 2238.58
low pulse occupancy: 1275442
ratio: 4.25
concentration: 2227.23
low pulse occupancy: 1445482
ratio: 4.82
concentration: 2540.95
low pulse occupancy: 1325400
ratio: 4.42
concentration: 2318.67
And what about if you use only P1 ?
If I use only P1, I have values like these ones:
low pulse occupancy: 9234646
ratio: 30.78
concentration: 44490.77
low pulse occupancy: 9105093
ratio: 30.35
concentration: 43035.06
low pulse occupancy: 7286404
ratio: 24.29
concentration: 26149.17
low pulse occupancy: 8102732
ratio: 27.01
concentration: 32946.49
low pulse occupancy: 7949507
ratio: 26.50
concentration: 31578.32
low pulse occupancy: 9407674
ratio: 31.36
concentration: 46491.93
low pulse occupancy: 9446295
ratio: 31.49
concentration: 46947.64
low pulse occupancy: 9551457
ratio: 31.84
concentration: 48205.27
low pulse occupancy: 9155035
ratio: 30.52
concentration: 43591.92
low pulse occupancy: 8365364
ratio: 27.88
concentration: 35395.64
Howdy, lets move the discussion over to my blog at indiaairquality.com so that we don’t take over Darrel’s blog 🙂
Darell,
Very nice article, however I have two comments:
1. Math. Since you used the same formula for both sensors, the outcome of the comparison should not be affected, but if you would like to compare readings of your sensor to some calibrated source, do not use average of averages to compute the final value. If you do the math, and calculate the difference between proper average using raw counts over integration time, and value computed using your method, you will see that it is non-zero (meaning the results are different).
2. Spikes: Make sure that the sensor is not exposed to sun, or artificial lightning. This could also be reflection of sunlight from a car parked on the street, or window in a building. Could be also light from a ceiling light, or desk lamp.
[…] To ensure that the sensing units were in dark condition and not affected by winds or air streams, I placed both units in a cardboard box with large apertures. The units were in vertical position to ensure the generated flow by the heater follows the expected path. […]
I have this ppd42 with arduino uno. but don’t know what to do with it yet. Do you have experiences with Arduino uno?
check this out
http://www.shadowandy.net/2015/05/arduino-dust-sensor.htm
and adding a 10k resistor to Pin5 to gnd, and also a fan are MUST. to get more stable readings.
Hi! Great post. I was interested to see if people were always taking the raw output or filtering it.
Do you happen to have a file containing the raw output for a really high sampling frequency? (like one value every second or even faster). People on the internet always display with one sample every 30 minutes so it is not possible to have an idea of the output of the sensor before buying one.
Thank you!
Here is my work with the dust sensor. I use a Particle Photon to make my sensor web enabled.
Just thought I would share or people looking for information.
Mathieu, by raw input I take it you still mean from P1 or P2. The samples are taken several hundred to thousand times per second and then averaged. I am also modifying the sensor to measure “before” P1 and P2. That will be a raw output before the signal processing on the board. More details to follow at:
https://indiaairquality.com/
[…] Otro proyecto que lo usa […]
[…] https://irq5.io/2013/07/24/testing-the-shinyei-ppd42ns/ […]
[…] Shinyei PPD42 […]
[…] https://irq5.io/2013/07/24/testing-the-shinyei-ppd42ns/ […]
[…] Dust readings of an alternative, Shinyei PPD42NS dust sensor – https://irq5.io/2013/07/24/testing-the-shinyei-ppd42ns/ […]
I’ve got problem with (I think) too high measurements. During 30s I have about 25s of LOW state on P2 pin. I checked my connections many times, compared it with different documents, pages about PPD42NS so I’m sure it’s connected good. I checked also voltage on P2 with voltmeter. Of course voltage was changing all the time, but very rarely I saw it over 3-4V. Most of time it was around 1-2V, sometimes below 1V.
Seeing such results I thought about voltage min rates. For PPD42NS low state is BELOW 0,7V. But for Arduino low is BELOW 1,5V. There’s 0,8V of gap. This can make measurements not accurate, because if 42 gives for example 1V (which is not low state for it) Arduino shows that it’s low state. Can it be a problem? If yes, how can I multiply by 2 (from 0,7 to 1,4V which is max for low state in Arduino) voltage that comes from 42 and also make sure that it won’t be over 5V?
Or… my measurements are correct and my air is so bad? 😉 Because what’s interesting, all measurements are very similar. It’s always between 24800ms and 25100ms. Always…
From what I’m aware the output is meant to be a digital output, so you *should* be able to interface it directly with the Arduino. However, if you are worried that there are some cases where the output will be considered “low” by the Arduino when it’s not, then you can use a transistor as a buffer. So the PPD42NS output drives a transistor that then drives the input to the Arduino. You should be able to find a transistor that meets your requirements of VH & VL voltages. If you don’t want external parts, you can consider using an ADC input of the Arduino and measure the levels yourself, but that really sounds like an overkill.
Hi Darrel, very interesting post!
I’ve two question about that: Sensor has two output (particles higher than 1.0um and particles higher than 2.5um). On the datasheet i can see onli OutPut1 curve, O2 has the same calibration to you?
However, which kind of particles it can measures using standard definition of PM1.0-2.5.10.0? So we know they are higher than 1.0 and 2.5 as said before.
But if I understand well PM2.5 are alla particles lower than 2.5um. So it consider PM1.0 too right? And the same for Pm10.0…In this way we don’t know the real value of Pm2.5 and 10.0 to compare with Air Laboratory data right?
Thank you,
Andrea
Hi Andrea, I have not checked the difference between both outputs, and the datasheet only specifies one output for PM2.5. It is also unclear (from the datasheet) what is the smallest size of particles the sensor can accurately detect, and I believe particles larger than PM2.5 will also trigger the sensor. So yes, you are correct in that without accurate equipment to test and qualify these devices, it is difficult to know for sure. More accurate particle detectors do exist, but it will not be as low-cost as this. One idea might be to add a specific PM filter in front of the device, but again, you will need to perform testing to verify.