collectd has always been able to grab interface traffic statistics from Linux. But what if we want to collect data about individual WiFi clients that connect to it? How much bandwidth is each of the clients using?
That information is already being recorded by the wireless driver; all we need to do is to query it. Turns out you can do that with the wl utility. This is Broadcom’s proprietary tool to control and query the wireless interfaces.
To do this, first use wl to get associated stations:
wl -i eth2 assoclist
Given a particular MAC address that is associated to the AP, query its info using sta_info:
# wl -i eth2 sta_info d4:a3:00:aa:bb:cc
 STA d4:a3:00:aa:bb:cc:
     aid:2
     rateset [ 6 9 12 18 24 36 48 54 ]
     idle 0 seconds
     in network 16 seconds
     state: AUTHENTICATED ASSOCIATED AUTHORIZED
     flags 0x11e03b: BRCM WME N_CAP VHT_CAP AMPDU AMSDU
     HT caps 0x6f: LDPC 40MHz SGI20 SGI40
     VHT caps 0x43: LDPC SGI80 SU-BFE
     tx data pkts: 663916
     tx data bytes: 68730715
     tx ucast pkts: 155
     tx ucast bytes: 42699
     tx mcast/bcast pkts: 663761
     tx mcast/bcast bytes: 68688016
     tx failures: 0
     rx data pkts: 234
     rx data bytes: 73557
     rx ucast pkts: 192
     rx ucast bytes: 62971
     rx mcast/bcast pkts: 42
     rx mcast/bcast bytes: 10586
     rate of last tx pkt: 866667 kbps
     rate of last rx pkt: 780000 kbps
     rx decrypt succeeds: 195
     rx decrypt failures: 1
     tx data pkts retried: 19
     tx data pkts retry exhausted: 0
     per antenna rssi of last rx data frame: -61 -56 -59 0
     per antenna average rssi of rx data frames: -61 -56 -57 0
     per antenna noise floor: -104 -98 -98 0
The “easy way” is probably to write a shell script, invoked via the Exec plugin that calls wl multiple times (once per interface, and once for each WiFi client) and uses grep or awk to get the information we need. This won’t be performant, of course.
wl itself does have quite a fair bit of overhead. It does some verification of the provided interface name. It checks for the Broadcom driver magic to ensure that the interface is a Broadcom device. It then needs to convert the MAC address from the argument string to binary, and vice-versa. Sure, that’s not really much “these days”, but we can definitely do better.
Instead, let’s short-circuit the process and write a plugin that directly collects the data, without going through wl. This way, we avoid creating several new processes for every query.
Querying Stats
wl is a closed source, proprietary tool but I did manage to find the source code for what looked like an older or different version, and it was marked as “open-src”.
After reviewing the sources, communication is made to the driver in a pretty standard way to how ethtool works: a socket is opened, and an ioctl is issued via this socket with a struct ifr containing the name of the interface you wish to query.
The structures used in the ioctl calls vary with each device family it seems, so you need the correct struct layout. Fortunately, the required structs and #defines are found in a header file, which is open source for sure because it is distributed in the ASUS router source code.
collectd Data Format
Next is understanding the structure to how collectd organizes its data.
So for example, df output is collected per disk like so:
/hostname/df-sda1/free
/hostname/df-sda1/used
Attributes for each partition (like sda1) are tagged to different plugin instances.
In our case, not only do we want to collect data for each interface, we also want to collect stats for each WiFi client, on each interface.
Fortunately, collectd has two levels of discriminators, one at the plugin level and another at the type level. Thus, our collected data fits within this schema like so:
/wireless_stations-eth1/assoctime-0a99deadbeef
                   ^^^^           ^^^^^^^^^^^^
               plugin instance               type instance
So each “wireless_stations” (the plugin) has wireless interfaces (plugin instance), and for each of these interfaces, the stations associated to those interfaces (type instance) will have several attributes (the type) collected, such as:
assoctime: associated timeidletime: amount of time the station has been idledecrypt_failures: number of failed packet decryptionstx_mcast_bytes: total size of transmitted multicast data- etc…
High Resolution?
In the new collectd v5, the entire pipeline now supports timestamps that are high-resolution. Is it really necessary to collect and store these data points with nanosecond accuracy? Also, if you are using InfluxDB for data storage, datapoints with second-resolution timestamps are more “compressible”, using lesser storage space.
So to address these issues, I have introduced 2 additional boolean configuration parameters, both of which default to true:
- NormalizeTimestamps
- SecondsResolution
NormalizeTimestamps will make timestamps from a particular collection run the same. In reality this is not strictly true because the queries are run at slightly different times. But having the same timestamp will naturally allow for easier correlation, so you know that a particular set of measurements were indeed from the same query.
SecondsResolution will force timestamps to be in units of seconds, i.e. the milliseconds and higher resolution will simply be lopped off.
What’s the Purpose of This?
Troubleshooting wireless issues. See if your devices are constantly disconnecting from the AP, and when. Are the devices having poor receiption?
With detailed wireless stats, at least you can narrow down the problem with these wireless clients.
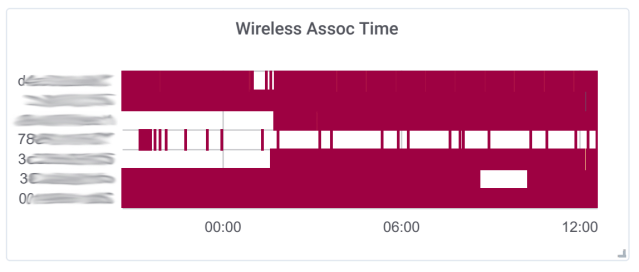
Empty areas indicate times when the client is not associated with the access point. It looks like when the device battery is low, the WiFi radio is only turned on when necessary.
Presence Indicator. Graph when people (or more accurately, devices) aren’t home. In fact, collecting RSSI values offers more detailed insight than just presence. With the data, you can also infer some behavior and/or location.
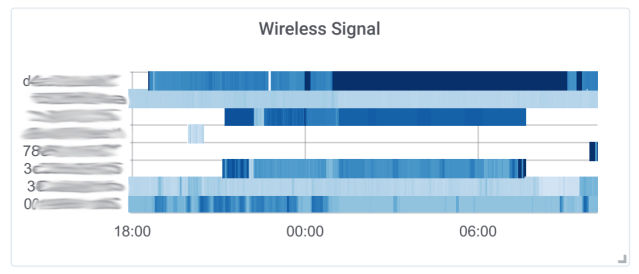
Missing blocks indicate the device is not present. Dark areas indicate poorer WiFi reception, like the bedroom for example.
Per-device Network Usage. Know which of your devices are sending and receiving data. Is a particular device downloading a lot of data? Is it abnormally uploading data while you sleep?
Download
The plugin is implemented in a single file, brcm_wl.c. It’s shipped as a out-of-tree plugin.
This builds on from my previous post about compiling and deploying collectd on ASUSWRT routers. It adds a build script and patches necessary to build a working binary.
Download it on GitHub here. For your convenience, I have also compiled and uploaded the binary packages for Asus RT-AC68U and the D-Link DIR-868L under the Releases section. Both of these are routers that use the Broadcom wireless chipset.
Let me know if you have some interesting applications for this data.
